
Key Takeaways
- A financial presentation works best when it simplifies complex data into a clear, easy-to-follow story.
- Strong decks highlight key statements, KPIs, trends, and forecasts without overwhelming the audience.
- Planning steps like outlining, selecting relevant data, and shaping the narrative make slide creation faster and cleaner.
- Tools like Tableau, Power BI, SlidesAI, and Canva help turn raw numbers into professional visuals.
- Effective delivery requires knowing your takeaway, using clean visuals, comparing results for context, and preparing for follow-up questions.
Financial presentation sometimes feels like a mountain of numbers, and let’s be honest, not everyone enjoys climbing that mountain. But if you arrange things the right way, the whole conversation becomes much easier.
Whether you want to share quarterly updates or walk people through a forecast, the aim is simple. You want the group to look at the numbers and think, “Okay, I get what’s going on here,” instead of feeling lost.
What is a Financial Presentation?
A financial presentation is the story behind the figures, told in a way that real humans can follow without squinting at rows of data.
Think of it as a guided tour through the company’s financial situation. Instead of dumping spreadsheets on people, you can explain what the numbers say. You highlight the important bits, connect the dots, and show how everything ties together.
Why Financial Presentation Matters?
A solid financial presentation does more than share numbers. It helps people understand what those numbers mean and how they impact the business. When the information is clear and easy to follow, teams and investors can make better decisions with confidence.
-
Clarity for Everyone
Charts and simple explanations break down complex financial data so all stakeholders understand the company’s position.
-
Smarter Decision-Making
Clear numbers and context help leaders and investors make informed choices on spending, strategy, and cost control.
-
Supports Investor Interest
Highlighting growth potential, performance, and plans helps attract new investors and reassure existing ones.
-
Builds Trust
A transparent, well-prepared presentation shows professionalism and boosts confidence among investors and partners.
-
Better Strategic Planning
Sharing financial results makes it easier to track KPIs, spot trends, and plan future goals more accurately.
-
More Engaging for Stakeholders
Visuals and storytelling make financial updates easier to follow, even for non-finance audiences.
-
Early Risk Detection
Presentations reveal financial weak spots, helping leadership respond to risks before they grow.
-
Ensures Compliance
Regular, accurate presentations help the company stay aligned with legal and reporting standards.
What to Include in a Financial Presentation?
Every good deck has a balance. There should be enough detail to be meaningful, but not so much that people lose the thread. Here’s what usually needs to be in there.
-
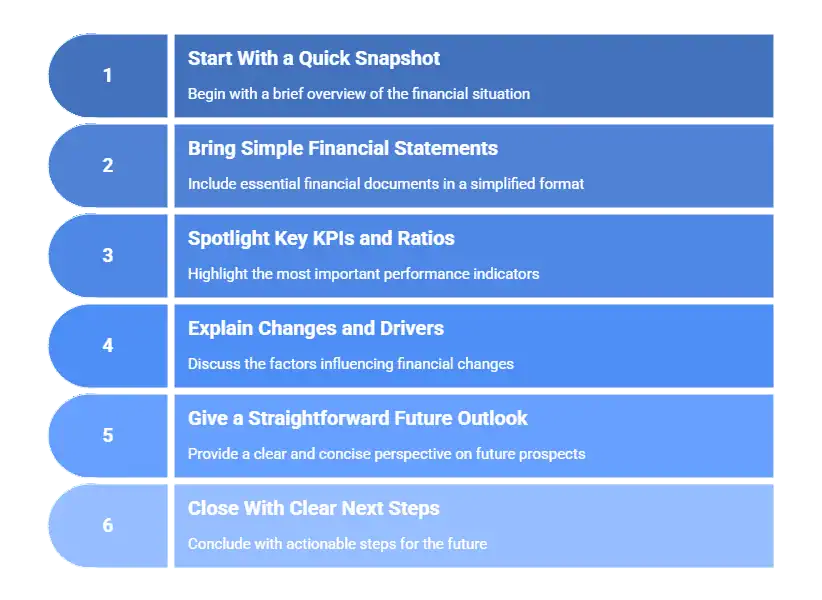
Start With an Executive Summary
Kick things off with a short overview. This is where you mention revenue shifts, profit patterns, or anything that stands out. It’s the warm-up before the deeper dive.
-
Bring the Main Financial Statements, But Keep Them Simple
Look at the balance sheet, income statement, and cash flow. Pull out the parts that matter to your main narrative. Nobody needs all the fine print unless they asked for it.
-
Highlight the KPIs and Ratios That Actually Matter
You don’t need every metric under the sun. Pick the handful that reflect the business clearly, maybe margins, liquidity, customer-related costs, or retention. The idea is to keep the focus on what explains the story.
-
Explain What Changed and What’s Driving It
Talk about trends, patterns, and shifts in your company’s financial PPT. Where are things going up? Where are they dipping? And why? Simple visuals help make the picture clearer.
-
Give a Straightforward Take on the Future
People want to know what’s next. Share your forecast, the assumptions behind it, and anything that might influence the outcome. Keep it honest and realistic.
-
Close With Clear CTA
End with a quick recap and spell out the actions, decisions, or points of attention you want the group to leave with.
<SlidesAICTA1 />
How to Create a Financial Presentation (Step by Step)

Before beginning to create a financial presentation for investors or other stakeholders, take a breath and line up your thoughts. It saves you a ton of fixing later. Consider the following steps
Step 1: Define the Objective
Ask yourself, “What do I want them to walk away with?” Once you know the goal, everything else falls into place.
Step 2: Start with a clear agenda
This doesn’t have to be fancy. Just outline the sections so the audience knows where the presentation is headed.
Step 3: Select and Organize Financial Data
Not every number deserves space on a slide. Choose the ones that support your core message and set the rest aside.
Step 4: Create a Rough Outline
Think of this like sketching before painting. It helps you avoid clutter and keeps the deck organized.
Step 5: Structure Your Presentation
Decide how each section connects to the next. You want the audience to follow the logic without jumping around.
Step 6: Highlight Key trends and developments
Focus on what changed and why it matters. Year-over-year shifts, budget comparisons, and unusual spikes all help tell the story.
Step 7: Financial outlook
Show your expectations, the reasoning behind them, and any risks or assumptions. Clarity beats optimism here.
Step 8: Conclusion
Summarize the big points and highlight the decisions or actions that should follow.
<SlidesAICTA3 />
Tools That Make Building Financial Presentations Easier
If you are a part of any finance teams, you know how critical the tools are that turn messy numbers into something clean and useful. These are the ones people usually reach for.
Tools for Digging into the Data
-
Tableau
Tableau helps turn large datasets into dashboards and visuals that make trends easy to spot.
-
Power BI
Power BI is a natural fit if your team already uses Microsoft tools. It is great for interactive charts and pulling data from different sheets via Power BI connector.
-
Python
Python comes in handy if you want to do deeper analysis, forecasting, or data cleanup before creating visuals.
Tools to design and polish your slides
-
SlidesAI
SlidesAI takes your notes or outline and turns them into slides automatically, which is a huge time saver.
<SlidesAICTA2 />
-
Google Slides
Google Slides is a simple, collaborative, and perfect tool for teams building a deck together.
-
PowerPoint
Decades later, PowerPoint is still the strongest option for detailed charts and professional formatting.
-
Canva
Canva is great if you want clean, attractive slides without doing a lot of design work yourself.
-
Prezent.ai
Prezenta.ai helps create structured business decks where consistency and storytelling are crucial.
Read Related: 10 Best AI Presentation Makers For Finance Teams
How to Present Your Financial Deck Like a Pro: Effective Tips
A good deck is only half the job. The delivery matters just as much. Check out some crucial financial presentation tips to help you deliver that PPT like a pro:
-
Be Clear What You Want to Achieve
If you know what you want people to remember, it shows in the way you talk through the slides.
-
Tell a clear financial story
Explain what happened and why. People connect better when they understand the journey, not just the outcome.
-
Break Complex Data Into Small Pieces
Short explanations and simple visuals keep the room engaged.
-
Create Graphs that are Easy to Read
Avoid overly detailed or crowded visuals. Clean and direct works best.
-
Use Comparisons to Make Data More Meaningful
Year-to-year or quarter-to-quarter comparisons add context and help people understand whether a change is meaningful.
-
Don’t Overload Your Slides
It’s tempting to add everything, but restraint makes your message stronger.
-
Prepare for Questions
Think ahead about what your team or leadership might ask. Having backup data builds confidence.
A financial presentation doesn’t need to feel heavy. With a bit of structure, a clear message, and visuals that actually help, you can turn complicated information into something your audience follows with ease. And with tools like SlidesAI, you don’t have to spend hours formatting slides to get there.
Frequently Asked Questions (FAQs)
1. How long should a financial presentation be?
A financial presentation should typically have around 15-20 slides, depending on the complexity and depth of the information. Ensure that each slide serves a clear purpose and contributes to the overall narrative.
2. What mistakes should I avoid when sharing financial data?
Avoid cluttering slides with too much information, using overly complex jargon, neglecting to explain variances, and failing to align your presentation with the audience’s interests and knowledge level.
3. How should I deal with sensitive financial info?
Share only what’s needed and follow your organization’s privacy rules. If possible, anonymize or group the data.
4. How detailed should the content be?
It depends on who’s in the room. Executives want high-level insights, whereas analysts might want more detail. Adjust based on your audience.
Related Posts
-

Presentations are a big part of student life, whether you’re in school, college, or stepping…
-

Final year presentations can feel overwhelming, especially when you know it’s one of your last…
-

You’ve got the lesson plan ready, but now comes the time-consuming part where you turn…
-

In a world full of smart gadgets and wearable tech, old-style PowerPoint presentations might not…
-

Creating presentations is a big part of student life. Whether it’s for assignments, projects, or…